

For a long time, partners have told us the same thing: when an investigation was closed as benign, it was hard to know what actually happened behind the scenes. You might see that our Security Operations Center (SOC) looked at something and decided it was not a threat, but not much about why.
That lack of visibility made a few things harder than they needed to be:
Explaining to end customers what Huntress actually did or didn't do
Showing the value of investigations that feel like a black box
Answering reasonable questions like, "What did your analysts find?"
The new Investigations View is our answer. It's a single place where you can see every investigation, what triggered it, and exactly how it was handled. Including those "closed benign."
Prefer to watch? Robert Knapp, Director of the Huntress Security Operations Center, walks through the Investigations View, including the timeline of every step an attacker took and every step the SOC took in response, even for investigations closed as benign.
New: Chronological timeline of security incident investigations
Let's jump to the most exciting part first: you can now drill into any investigation to see a detailed, chronological timeline of everything that took place from first signal to final resolution. And you can easily export this information as a PDF to share with stakeholders.
The investigation timeline includes:
Signals that led to the investigation
Analyst notes and context
Incident reports, if one was generated
Recommended and completed remediations
Final resolution and status
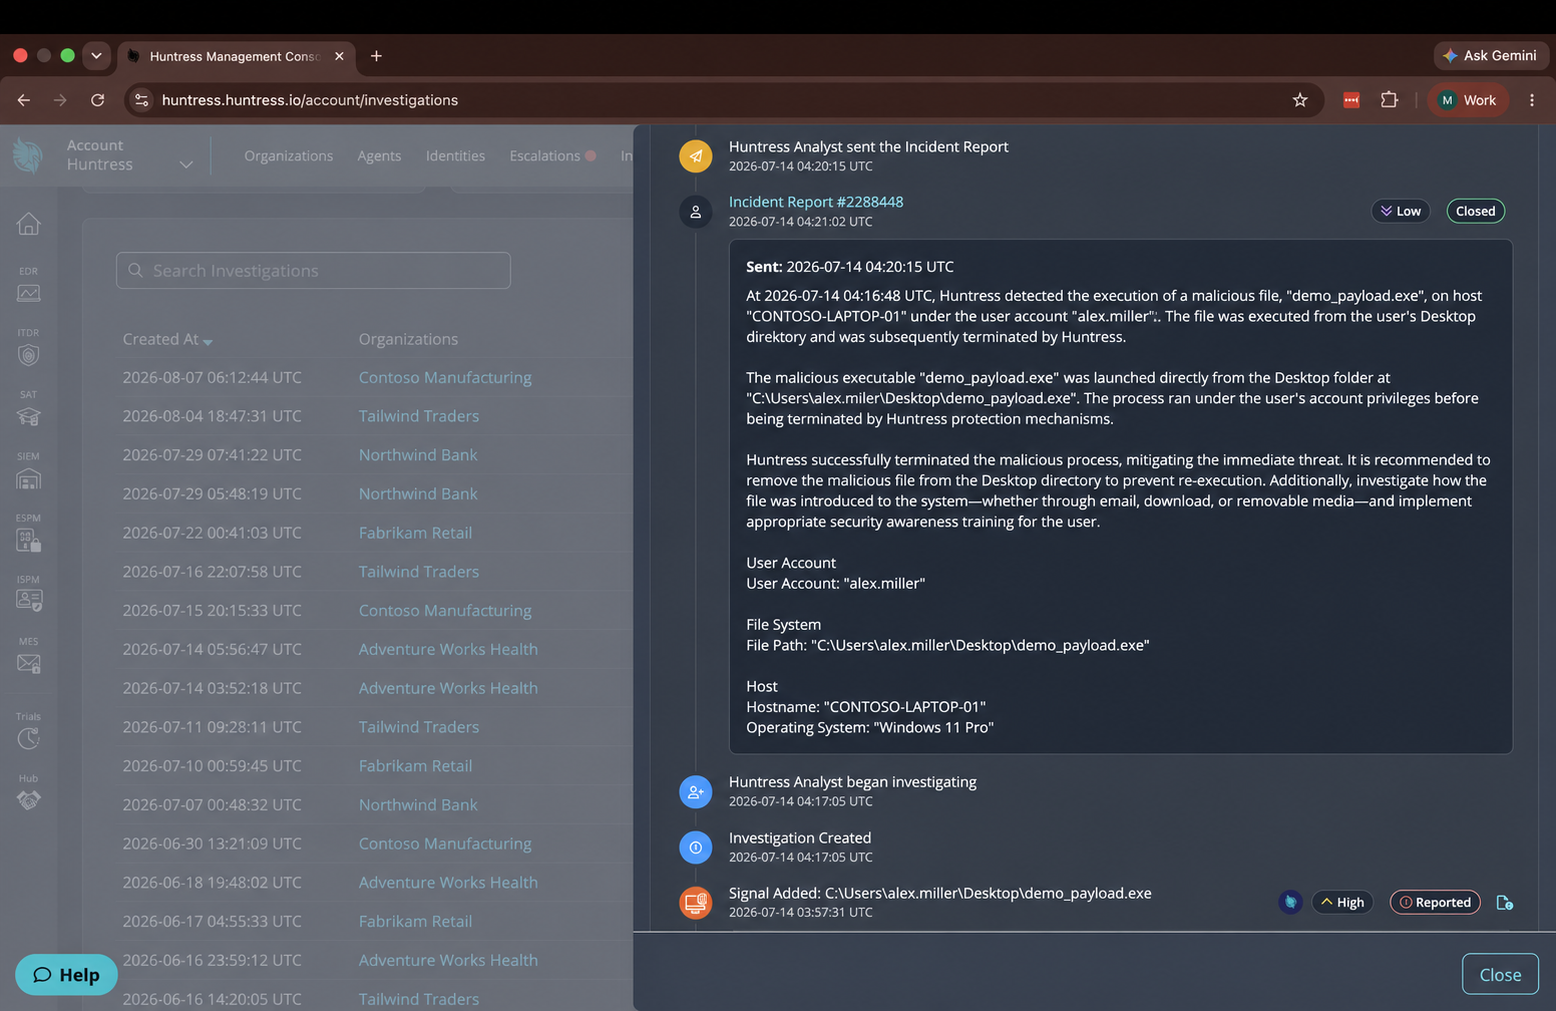
The investigation details view shows a full, ordered timeline of every signal, analyst action, and decision.
This view turns what used to be a black box into a glass box: partners can see not just the outcome, but the work the Huntress SOC performed to get there. Even for investigations that determine activity is benign.
Redesigned: A dashboard for every investigation
Ok, let's zoom out from the details a little. Where do you find these delightful investigation timelines? When malicious activity is detected, they are now included by default in all Incident Reports. But you can also see the full list of investigation summaries in one place if you head over to the redesigned Investigations Dashboard. Here's how:
Sign in to the Huntress portal
Navigate to the Investigations tab in the top navigation
Use the search and filters to find the investigations you care about most

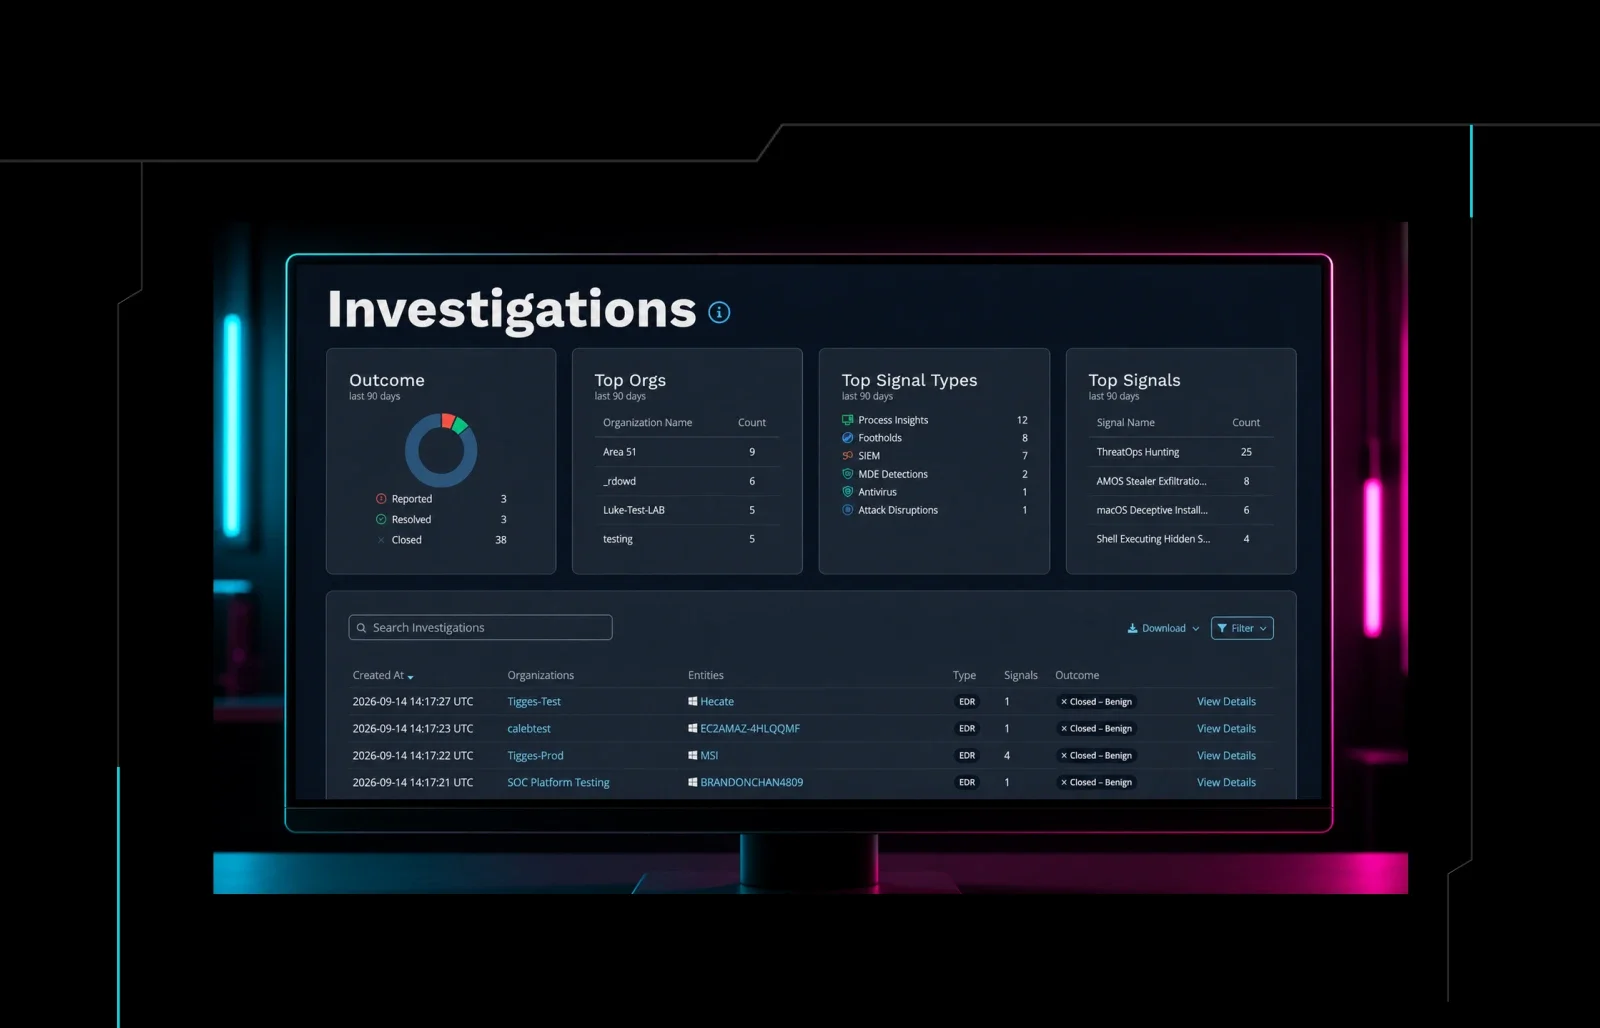
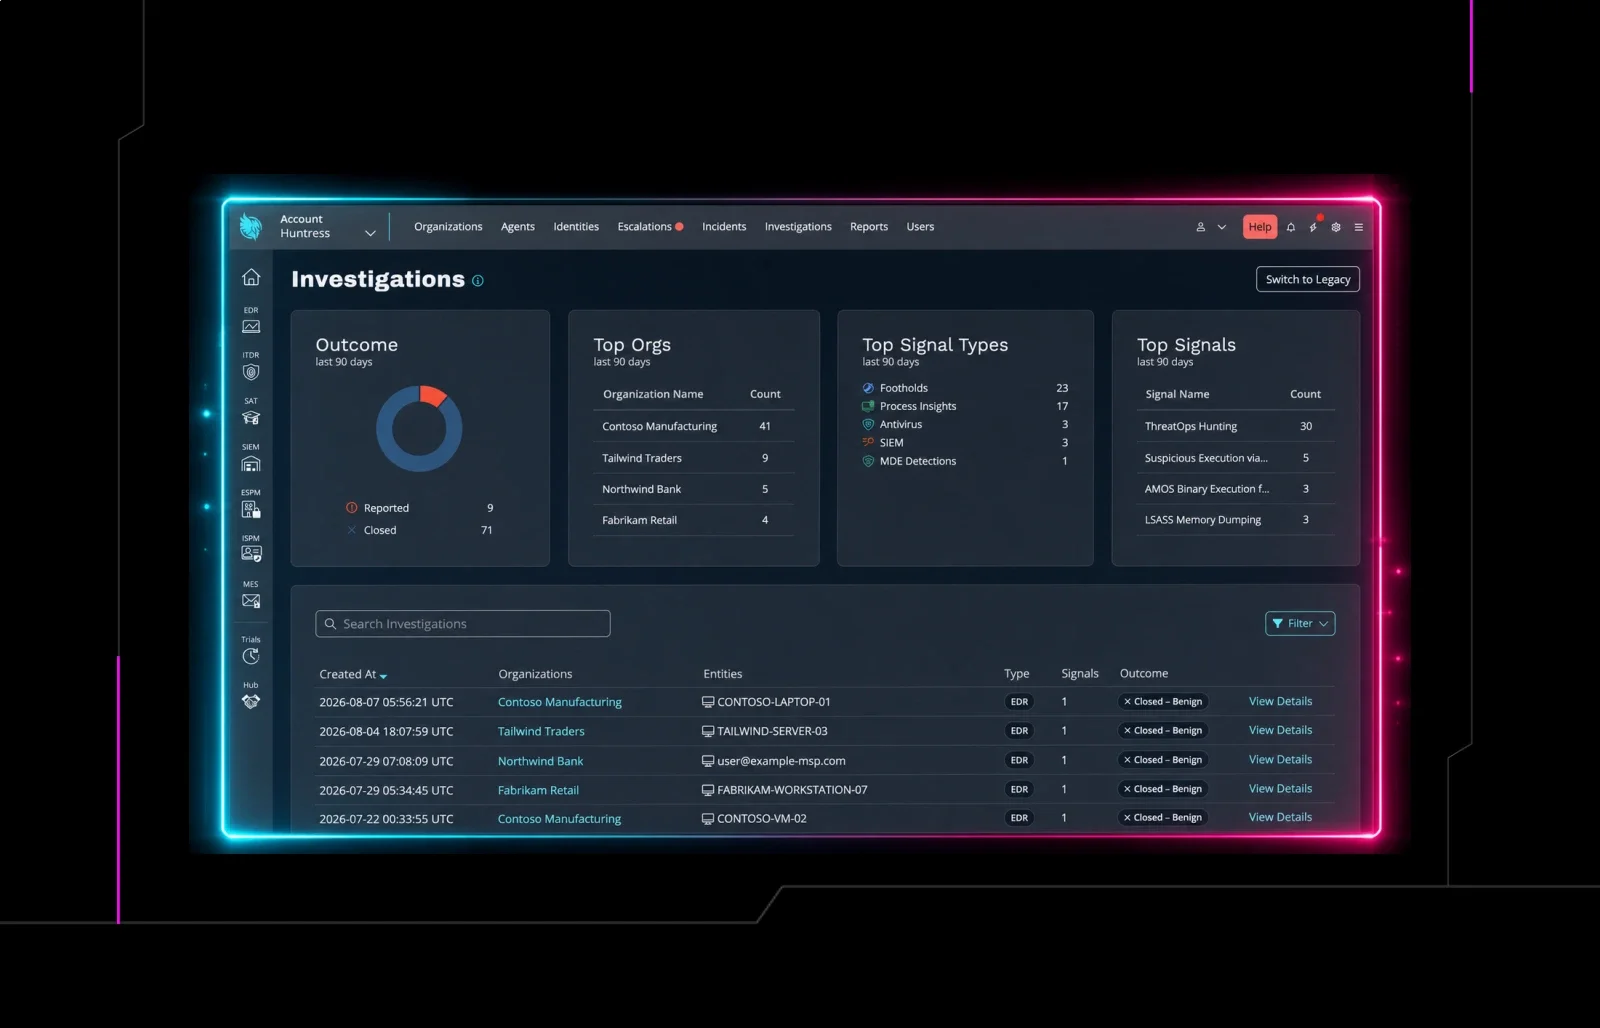
At the top of the dashboard, you'll find some high-level KPIs, including how many investigations were closed or reported, the organizations within your account that saw the most investigations, top signal types, and more.
Below that, you'll also find a row-by-row view of everything our SOC has investigated across your tenants. Review the summary to get a quick overview of each investigation, including:
When the investigation began
Which customer and which endpoint, identity, or other asset was involved
How many signals contributed to the investigation
Status, including investigations closed as benign or reported
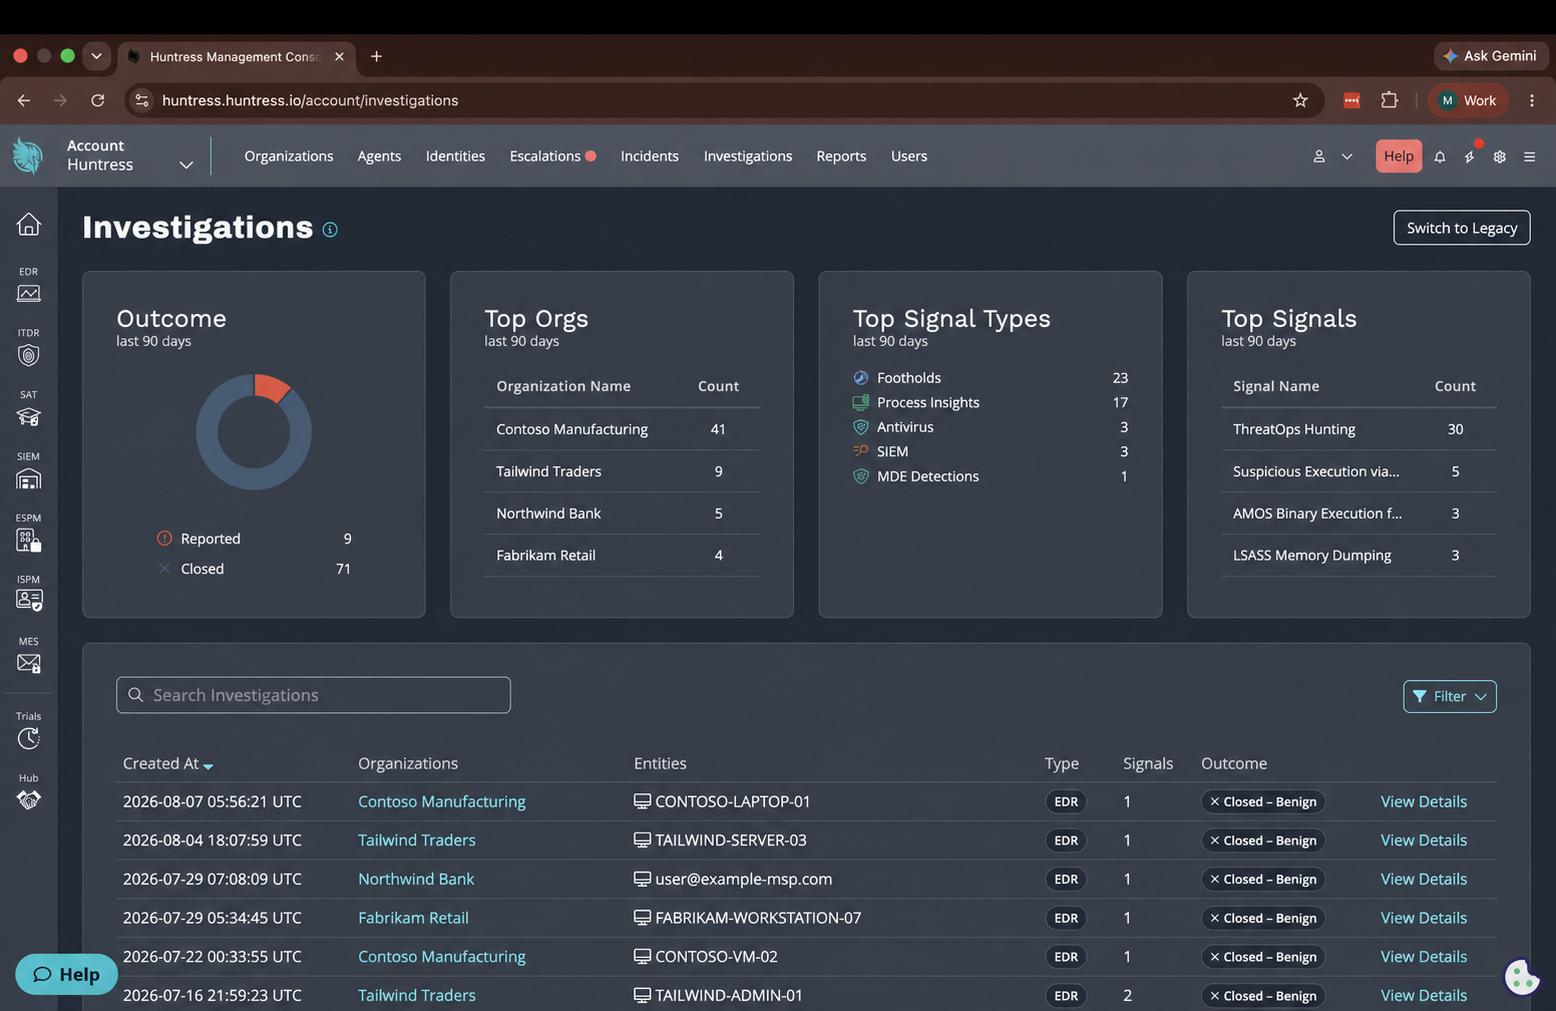
The Investigations dashboard gives partners a single view of every Huntress investigation, including those closed as benign.
From here, partners can quickly search, filter, and jump into the details that matter most for an organization or endpoint.
How to use security incident investigations in your organization
The goal of this experience is simple: help you tell a clearer story about how Huntress is protecting your organization or customers.
With the Investigations View, you can:
Show the volume of investigations our SOC handles on behalf of each organization
Walk through specific investigations during QBRs or security reviews
Answer tough questions from security teams about why something was considered benign
Demonstrate that Huntress is continuously watching, investigating, and documenting work, even when there is no incident to report
We want your feedback
This is an important step in making the Huntress platform more transparent and more useful during stakeholder conversations. But it's not the last one.
If you have requests, ideas, or feedback on the Investigations View, please let us know at https://feedback.huntress.io/.
We are listening, and we will continue evolving the Huntress portal based on your input.