


We’ve all seen threat reports and intrusion write-ups that look deeply polished, with a cohesive timeline that highlights incredible telemetry and analysis skills. Cool diagrams abound, illustrating threat actor kill chains, beaconing, credential access, the works! Indeed, we—myself included—all love these kinds of write-ups, which highlight various products and services and elevate the entire industry by sharing knowledge.
What happens, however, when there are gaps in telemetry? Logging turned off, a forgotten server, a legacy something under someone’s desk that performs critical business functions.
In these scenarios, we, just like the great Skee Lo, find ourselves saying, “I wish…”
- I wish this server had the event logs I need
- I wish we had access to network telemetry from Y host
- I wish that logs were flowing to a SIEM, as they have rolled over on the VPN device
- I wish this Azure service had its diagnostic setting turned on
The I wish list goes on and on.
Sometimes, we can wish all we want. To be taller, to have a ‘64 Impala, or for more telemetry, and yet our wishes won’t be granted for whatever reason.
In these scenarios, we have two options: give up and accept defeat in a fit of frustration or get to work, imperfect as the data may be.
In this blog, we’ll highlight some techniques that the Huntress Tactical Response team utilizes in order to provide maximum partner value, even in the face of imperfect telemetry.
Let’s begin with the story of the missing Windows event logs.
Missing Windows Event Logs
In a recent case, we were alerted to a suspicious user creation event occurring on a host.
Normally, in these scenarios, we’d look at who added the user, and then use that as a pivot point or thread to be pulled on. Tracking authentications in Windows environments can sometimes be tricky, even if all the necessary logging is turned on.
In this particular scenario, we observed that the user was created by the machine or SYSTEM account. This suggests that some kind of lateral movement occurred, whereby the host that had the user created on it was accessed by another host through something like WinRM, WMI, or maybe even an RMM.
To get better answers, we turned to Windows Security 4624 events to see where the authentications for the affected host were coming from.
Surprisingly, we didn’t observe any 4624 events for the day of the incident, which in this case was October 1, 2025.
Zooming out a little bit, we built a time chart showing how many 4624 events were logged on a one-day basis to ascertain when the last 4624 was logged.
This is what we found:
Figure 1: Chart showing absent Windows Security 4624 on a host of interest
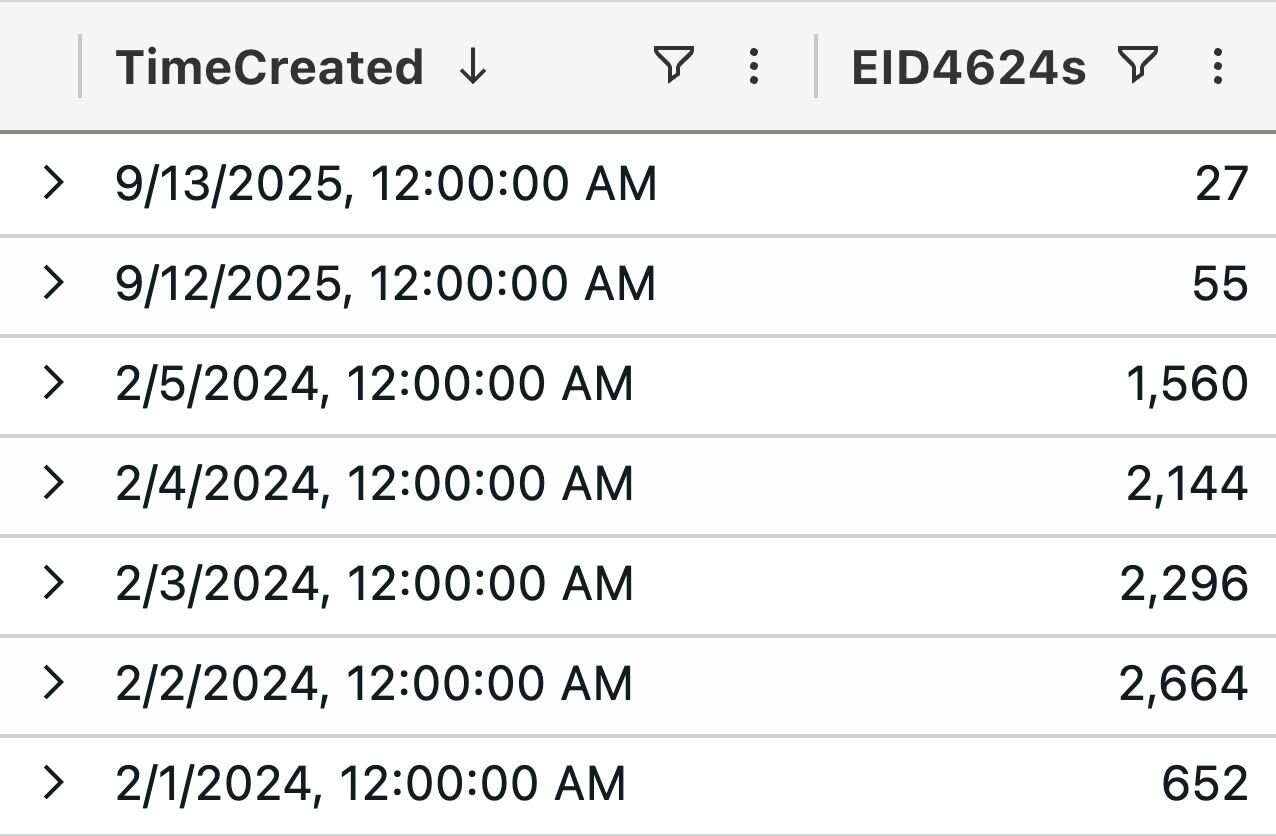
Disappointingly, the last 4624 event was logged on September 13. That’s not very useful for an incident that occurred on October 1.
“What about other authentication events?” you may ask.
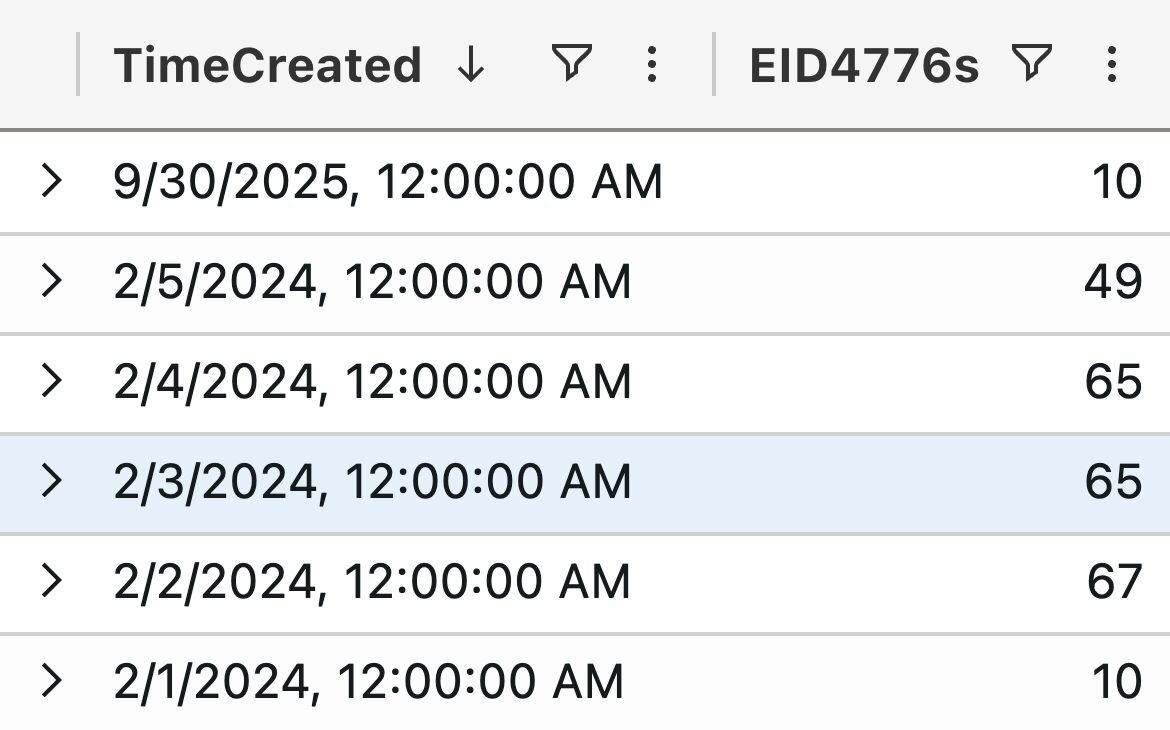
Luckily, in this case, the 4776 credential validation events were a bit more recent:
Figure 2: Chart showing Windows Security 4776 events on a host of interest
These events didn’t yield much additional information. We also examined the DNS cache, active connections, and other endpoint artifacts, with no luck in determining where the user account was created from or what connections were made to this host.
Where to go from here?
When dealing with intrusions, we often focus on the purely technical and lose sight of the human element. In this instance, we communicated our findings to the partner. We let them know that this machine has had its audit policy changed, which resulted in it not logging critical authentication events that would help us illuminate the incident and answer partner questions.
Rather than simply focusing on what we don’t have, we focused on what we knew: we suspected that the affected machine was accessed laterally, but we don’t have conclusive evidence to show from where exactly it was accessed.
At this point, the partner did a bit of digging on their end and discovered that this particular endpoint was exposing a service to the internet that should not have been exposed. This service, if exploited, may have allowed for a threat actor to run commands on this machine in the context of SYSTEM.
This dynamic nicely illustrates the importance of transparent and sharp communication between all stakeholders. We could’ve spent hours digging into the endpoint and its surrounding systems, attempting to locate the source of the user account creation. Without communication, however, we’d have had no way of knowing about the exposed service on this machine and how this particular service functions.
Although we couldn’t identify the source of this intrusion with 100% certainty due to the absence of telemetry, we could still drive positive security outcomes:
- By communicating transparently and with intention, we were able to work with our partner to identify the likely source of the intrusion
- We identified a critical telemetry gap on their endpoints, and we were able to pinpoint how and when audit policies had been changed on the hosts
- The partner was able to identify an errant exposed service on their hosts
- After the incident, we also examined the partner’s external presence and identified some other services that were exposed
This scenario bubbles up a good question: would the above outcome have been drastically changed had the host been logging 4624 events?
Although we crave the satisfaction of a neatly wrapped-up intrusion case, I’d argue that in this case, the overall outcome would not have been drastically improved had the 4624 events been present on the host.
What do you do when logs roll over?
By default, a Windows host will store 20MB worth of data in its security log file. Even the cheapest and most basic old-school MP3 players of old stored more than this! And yet, this default is often not changed in environments.
This dynamic applies to not only Windows hosts but also VPN devices as well.
We run into this scenario frequently, as Figure 3 shows:
Figure 3: Illustration of Slack searching showing instances where we have had logs roll over on devices of investigative interest
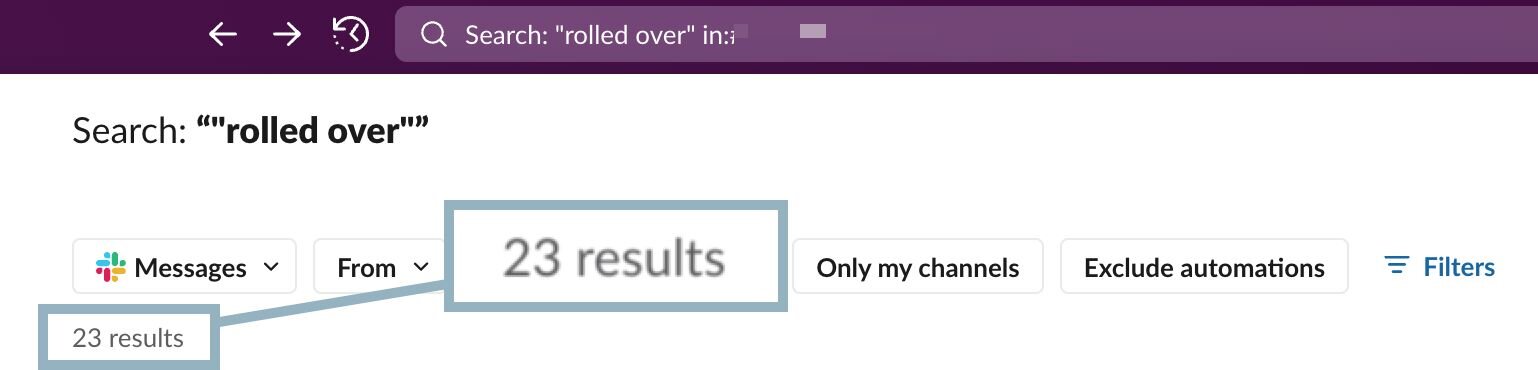
This search illustrates that in the last few months, we’ve had 23 instances where a log has rolled over, either on a host or a VPN appliance.
Logs rolling over are a very common occurrence, one that responders need to learn how to deal with and work around.
On Windows machines, it is common for the Security log channel to roll over as if a brute force were to be occurring. It would normally generate a bunch of failed Security-4625 events which would quickly fill up a default-sized Security log channel.
Do we give up our analysis at this point? Of course not!
A brute force event may fill up a log channel on a host, but it also provides us with clues like IP addresses, workstation names, time windows, and others. Use this information as a pivot point and check other hosts in the environment, as they may either not be subject to the same brute force attack or have their log channels configured to accommodate larger sizes.
Other log channels like Application and System typically don’t fill up as quickly as the Security log channel, so it’s also worth examining these for signs of threat actor activity. The Application log channel is particularly useful, logging various application installs and such.
This same dynamic applies to VPN devices as well. Often, on-device log storage maxes out if the appliance is subject to a brute force attack or even general internet noise. As we’ve blogged about before, VPN appliances are a popular initial access vector for threat actors, so we spend a lot of time looking at VPN telemetry.
Sometimes, we observe VPN telemetry where a login event has rolled over, but a logout event is present and indicates malicious activity. Depending on how a particular environment is configured, these events may only contain internal and not external IP addresses, but still provide important context.
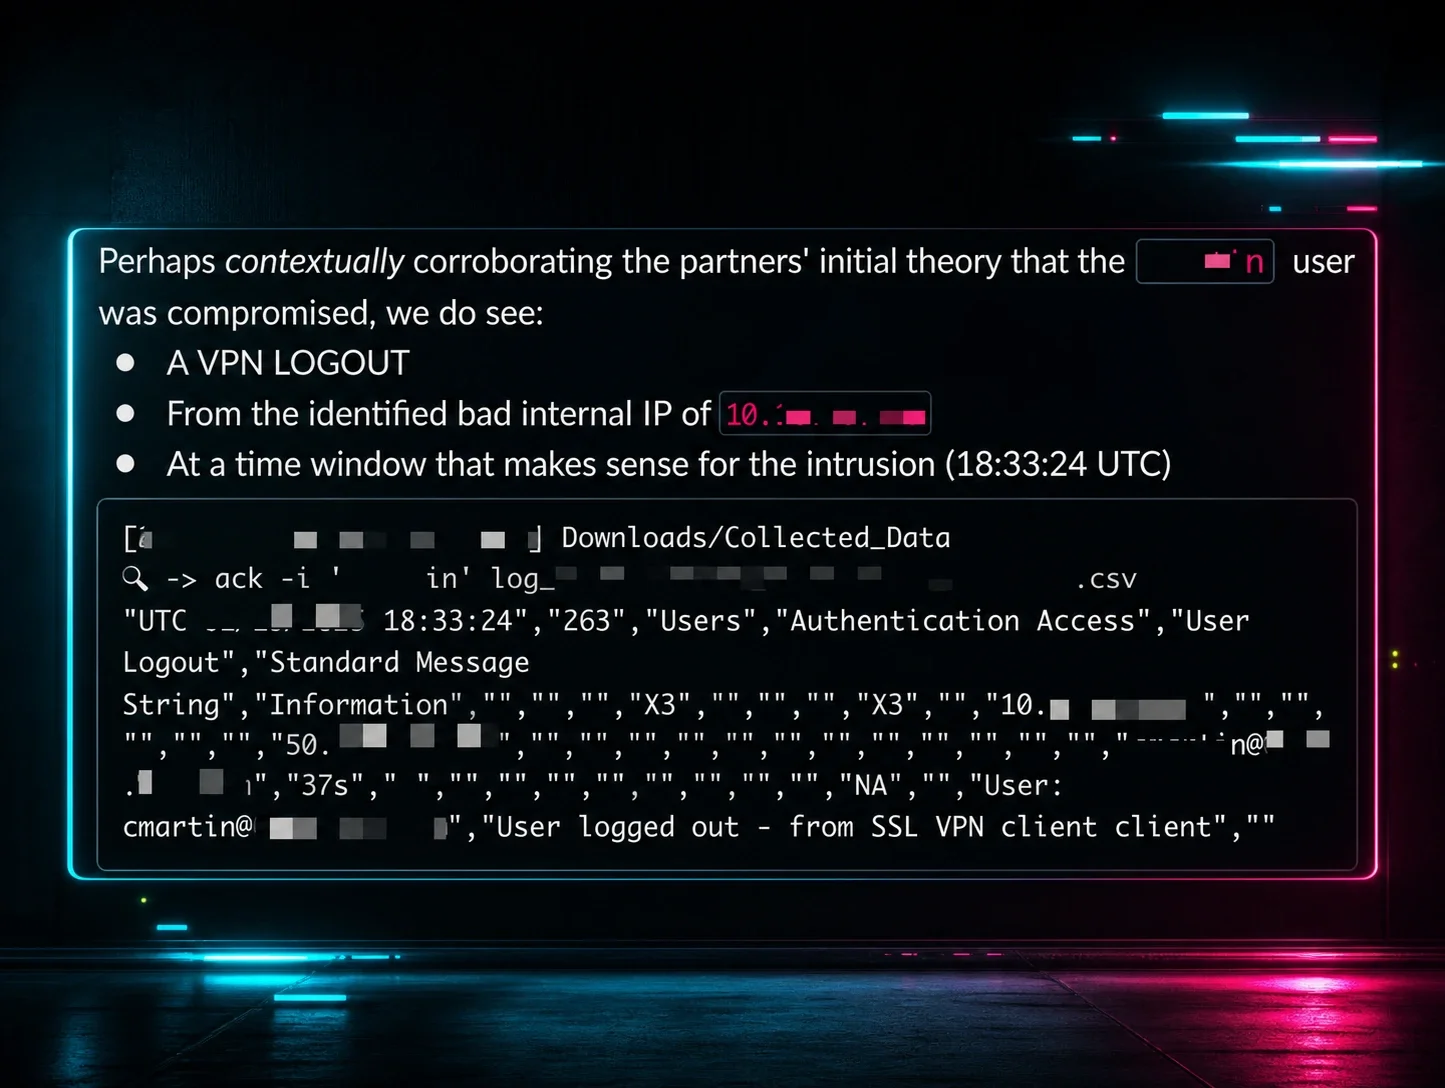
A key piece of telemetry is provided via VPN logout events: IP assignments. If we use Windows Event Logs to ascertain that a particular IP address was assigned to a machine belonging to a threat actor, we can potentially trace this back to its initial access vector—if the compromise occurred through a VPN—using only logout events as illustrated by the screenshot below:
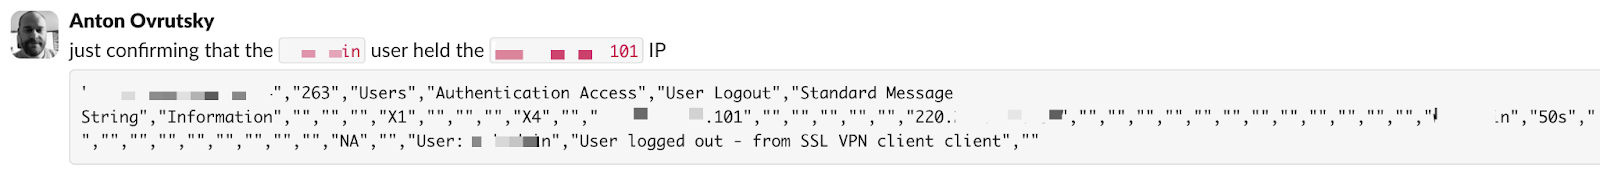
Figure 4: Image of a Slack message showing a logout event from a VPN appliance
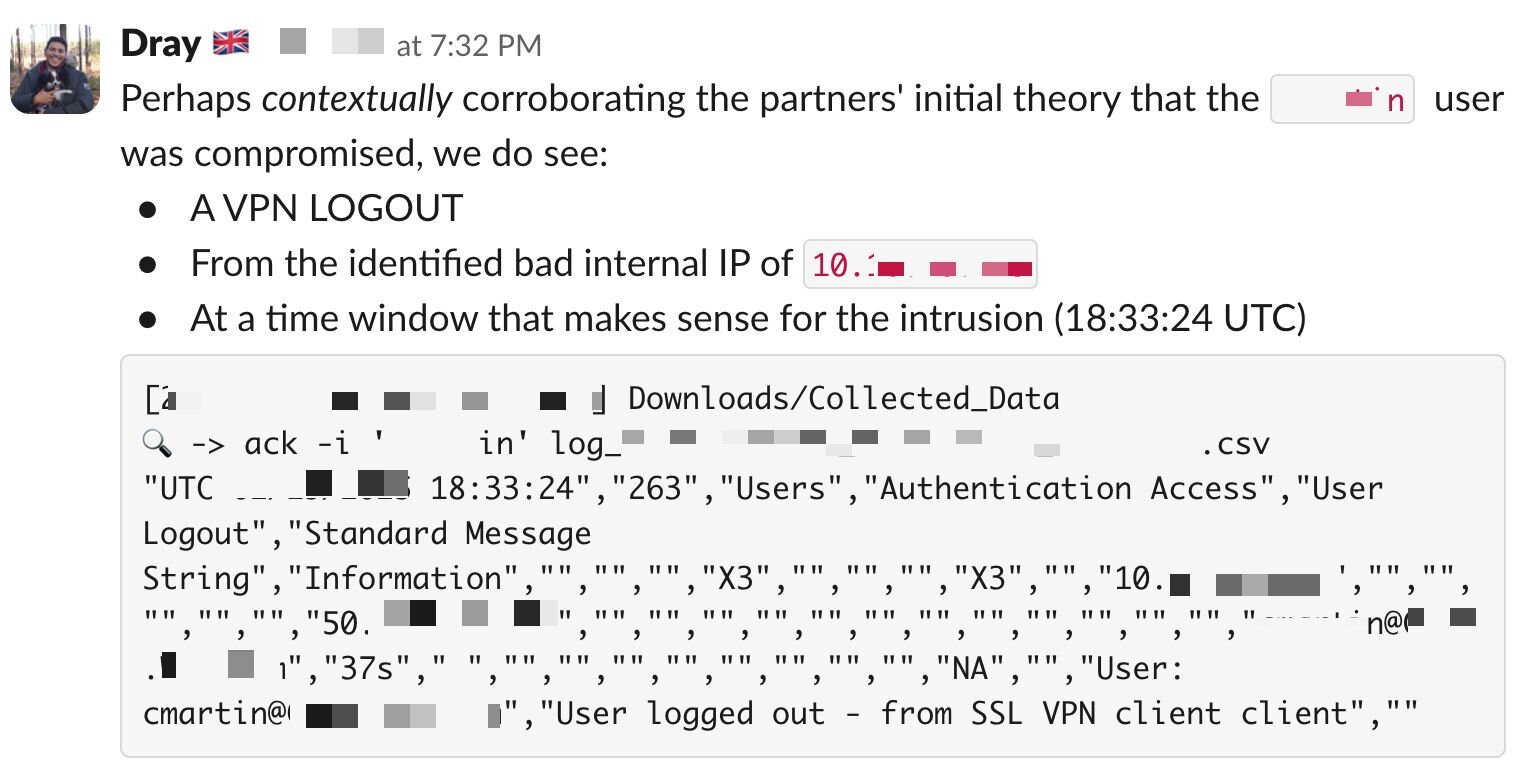
Likewise, we can also combine this IP assignment telemetry with a temporal element, serving to strengthen analysis hypotheses, as illustrated below.
Figure 5: Image of Slack message showing analysis of VPN log without a login event present
These examples illustrate how even imperfect data can be used to solve tough intrusion cases and provide our partners with as much security value as possible.
Patchy clouds
So far, we’ve focused on endpoints and VPN appliances when examining how to deal with imperfect or degraded security telemetry. This dynamic is greatly exacerbated in cloud environments, as logging configurations are scattered across various services and are often difficult for security teams to fully wrangle.
Microsoft Entra alone has about 18 distinct log types available, spanning AuditLogs, SignInLogs, all the way to more advanced and newer log types like MicrosoftGraphActivityLogs.
When investigating cloud intrusions, we should probably assume that many of these log types will not have their corresponding diagnostic settings enabled.
If we zoom out a little bit and look at the broader Microsoft 365 ecosystem, there are approximately 150+ different log types for Azure services spanning storage, network, and various application services. This is in addition to another estimated 150+ log types for Office 365, which include aspects like SharePoint, Teams, and Power BI. In total, as estimated by an LLM crawling Microsoft documentation, there are as many as 900+ different log types across the Microsoft 365 ecosystem.
In some popular attack chains within Microsoft 365, like phishing, SignInLogs may be enough to spot anomalous authentications. However, if the threat actor moves to other services like Teams or SharePoint, different types of telemetry strands are required to reconstruct a full timeline of threat actor activities. In many cases, these logs are simply not enabled.
In these scenarios, no amount of technical know-how will help you, and a shift in mindset is required to explain this gap to relevant stakeholders in a manner that’s constructive rather than defeating.
Logging gaps will always be present in environments, and in particularly complex environments like within the Microsoft 365 cloud, these gaps may be present more often than we in the practitioner community would like.
The below sections cover some practical tips and general guidance on dealing with degraded, missing, or otherwise absent security-relevant telemetry.
Practitioner takeaways
If you’re newer to the field of detection, response, or hunting and have found yourself dealing with imperfect telemetry, we have the following tips:
- Focus on the broader context rather than a particular atomic event
- If you don’t see an event or telemetry strand present, do not give up hope!
- At the same time, know when you’ve reached the limits of what’s technically feasible: telemetry cannot be manifested, only logged
- Communicate what you know and what you don’t know clearly, with purpose, and without blame
- We all love labs where all the telemetry we could ever want is turned on—practice in a lab environment with limited or degraded telemetry, as this may help you discover newer or otherwise overlooked bits of telemetry that may be useful in your investigations
- Don’t get caught up with what you don’t have, but focus on what data is available to you and how it can be used
- Calling out missing telemetry is great, but explaining to stakeholders why this telemetry is critical, how to enable it, and where to send it is even better!
Partner takeaways
Want to help us help you while ensuring that telemetry from your critical devices is available for analysis? Then we have the following to share:
- Double and triple-check your GPOs to ensure that your preferred audit policy is being applied to all endpoints in your environment
- Similarly, take an inventory of cloud services utilized in your environment and double-check that the relevant telemetry is not only enabled, but also sent to a SIEM for analysis
- Speaking of GPOs, you can use them to set your log channel sizes as well! Ensure that log channel sizes—especially for critical channels like Security—are set to at least a few GBs
- Ensure that you’re deploying the Huntress agent on all your assets, not just servers or domain controllers
- Consider utilizing our Managed SIEM—shipping Windows Events and VPN logs in particular to a SIEM helps protect you from logs rolling over or logs being cleared by a threat actor
Conclusion
In this blog, we covered various techniques and methods utilized by the Huntress Tactical Response team when dealing with intrusions in a telemetry-degraded environment. Cases where perfect telemetry exists for every nook and cranny that you want to analyze are few and very far between. A myriad of technical and non-technical aspects serve to make real-world environments differ drastically from the various lab and CTF environments rightfully beloved by the security community.
A key takeaway from this blog is that we should focus more on investigating environments with imperfect or degraded telemetry. In particular, we need to be able to adjust not only our communication styles when faced with such environments, but also our investigative orientation.