


When you’re performing intrusion analysis, it’s easy to get disoriented.
There are usually hundreds of Windows event IDs to sort through, generated by potentially thousands of endpoints. Indeed, this Gordian knot is not easily untangled.
How does one find the needle in this proverbial haystack?
Most write-ups will focus on particular Windows event IDs: look at event ID 4625 to find brute force attacks.
Armed with this information, an instance of Windows Event Viewer is opened and filtered for 4625 events, which show thousands of results with different usernames and timestamps, some events going back months.
Has this organization been breached for months? Are all these user accounts compromised?
This is the difference between information and analysis.
A 4625 event is just a piece of information. To provide value and insights, it needs to be turned into an analysis and contextualized.
This blog outlines some of the techniques and methodologies used by the Huntress Tactical Response team to suss out intrusions and turn information into actionable insights for our partners.
Authentication events
Let’s begin by looking at authentication events. We’ll focus on successful 4624 and failed 4625 logins here, as these events are enabled by default and present on hosts in most cases.
It’s very easy to gloss over the nuances that exist within authentication failure events, so let’s look at some examples.
Here we have two 4625 Windows events side by side:

Figure 1: Image showing two 4625 Windows security events
Event 1 illustrates a failed login for the username “Tom,” while Event 2 shows a failed login for the username “Administrator.”
We have the “information” here: failed logins for the "Tom" and "Administrator" accounts. We also have the source IP address and workstation name. This is fantastic information indeed, as we have a few more pivot points now. However, we need to peel back the layers here to extract analysis from these two events.
If you look carefully, you’ll notice that the SubStatus field for these two events is different.
Event 1 has a SubStatus of 0xC0000064, whereas Event 2 has a SubStatus of 0xC000006A. If we look at documentation for event ID 4625 via Ultimate Windows Security, we see a handy table translating these values for us:

Figure 2: Windows security event ID 4625 error code translation table
Now we can turn the information from the 4625 events into some insights!
In the context of intrusion analysis, a failed login event that contains a username that doesn’t exist in the environment is extremely suspicious. Of course, scanners and misconfigured applications cause this dynamic. However, if the activity isn’t historically observed, it should be treated as a priority thread to pull on.
This kind of analysis will also help you weed out suspicious/malicious failed logins from those occurring normally due to expired passwords, users entering their passwords incorrectly, etc.
If we look at Event 1 again, we now have the following points to work from:
- A failed login occurred from an unknown workstation (WORKSTATION)
- This failed login attempted to authenticate with a username that doesn’t exist in the environment
- The login occurred from an IP address that isn’t found in any organizational inventory tooling
In this case, we took a piece of information (a singular 4625) event, and turned it into an actionable insight by simply looking closely at the various status and sub-status codes contained within it.
Let’s take a look at another example, this time using 4624 (successful login) events.
Again, we have two similar-looking 4624 events side by side.

Figure 3: Two Windows security 4624 event IDs side-by-side
Both these events show a successful login for the Administrator account, so how do we spot the suspicious one?
A key field here is the AuthenticationPackageName field—Event 1 has an “NTLM” for this value, and Event 2 has “Kerberos”.
Tooling that performs brute force attacks often has options to configure whether NTLM or Kerberos is used. The scanner/smb/smb_login module from Metasploit can configure this setting, for example:

Figure 4: Illustration of configurable authentication methods within Metasploit’s smb_login module
Although this option can be changed, why not take advantage of a threat actor’s laziness for our gain?
In this case, we have two similar-looking 4624 events, but through analysis and methodology, we can differentiate Event 1 as more suspicious than Event 2, given the following factors:
- Observed NTLM authentication
- This point carries much more weight if you look at historical patterns of authentication and identify that this is the first time a particular account uses NTLM for authentication, rather than Kerberos
- A suspicious workstation name of WORKSTATION
The first and second examples outlined are not to be viewed in isolation. Often—and as experienced by our team in real-world intrusions—these two dynamics play out in tandem. That is, a threat actor will land in the environment and perform some kind of brute force or password-spray attack before finding success with an account in the environment.
By looking closely at just two Windows event IDs, we can potentially gather information about the source of the brute force, what accounts were compromised, from where they were compromised, and whether this activity is malicious or legitimate.
So far, we’ve been looking at one event at a time. However, if we think about what a successful brute force looks like, we can assume that successful login events will be generated on multiple workstations within our domain.
In addition, these events will likely share the same suspicious characteristics outlined so far regarding authentication protocols and workstation names.
Let’s take a look at what this looks like in practice.
In this scenario, a threat actor has landed in an environment and successfully brute forced three different hosts on the network:

Figure 5: Image showing successful brute force via Metasploit
Rather than looking at an event individually, let’s look at all three authentication events generated by the above brute force.

Figure 6: Three distinct Windows security 4624 events showing a successful brute force
We can see three distinct 4624 events with successful logins and events generated on the host to which the authentication was successful. What can we glean from these events? Quite a bit!
We see:
- A single account (Administrator) authenticating to three distinct systems: win11v, win11a, DC
- All three authentications occurred at the same time
- All three authentications came from the same IP address and workstation combination
- All three events used the NTLM authentication protocol, not Kerberos
Once again, we can turn information from a singular event into insights by just a little bit of aggregation.
Typically, some kind of logging platform or SIEM would be used to analyze this data, but these kinds of systems aren't available to everyone. And even if they are available, writing effective queries is often difficult and comes with a steep learning curve that isn’t feasible for some organizations. Sometimes we’re left with bare bones tooling like Windows Event Viewer or PowerShell, and we need to make the most of it!
Just two different Windows event IDs, when properly analyzed, can give us a ton of insight and bubble up additional threads to pull on during investigations. Below is a mind map of some considerations and analysis techniques for these two events.

Figure 7: Mind map of 4624/4625 event ID analysis
Let’s switch gears slightly and look at some credential access avenues, particularly registry credential dumping.
Credential access
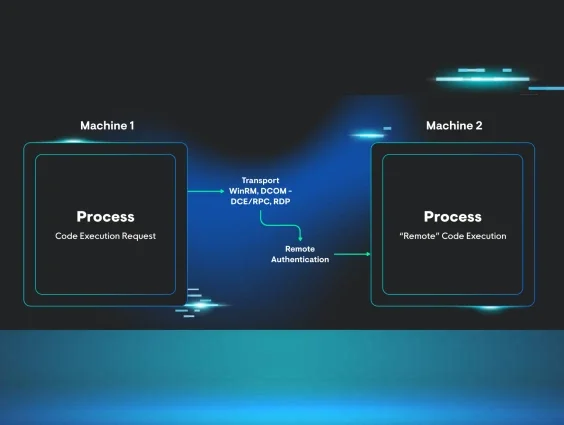
One of the most popular types of credential access attempts that we see on the Tactical Response team is registry credential dumping. This technique can be executed remotely from the threat actor's machine, and gives them various credential material in the form of hashes that can then be passed or cracked.
This technique does not require the threat actor to upload anything to the victim’s machine and does not require interaction with the LSASS process, making it a popular technique for threat actors trying to avoid endpoint detection.
The threat actor's view of registry credential dumping looks something like the following.

Figure 8: Image of successful registry credential dumping via Impacket secretsdump
If we then look at the event logs generated from this activity, we can see our old friend 4624 again.
We can see again that the authentication protocol for this event is NTLM, and the source network address belongs to the same IP address that we observed brute forcing our environment.

Figure 9: Image showing a 4624 event resulting from registry credential dumping
This event contains an extremely useful field called the logon ID, which we haven’t covered yet, so let’s look at it.
Think of this field as the “glue” between disparate Windows events. It’s a way to track what a particular login session did on a host through a common field. You’ll often hear security professionals on the defensive side of the infosec spectrum talk about “pivoting” off certain values. Indeed, a logon ID is a prime candidate for pivoting.
Ideally, you’d use a SIEM to craft a query showing the various activities undertaken by a certain logon ID, but a SIEM isn’t always available. A handy trick is to simply put a suspicious logon ID into a search text bot within the event viewer, and click on “find next” to see the events that come up.
An example of this low-tech technique is below.

Figure 10: Animation showing a simple technique for pivoting off a Login ID
We can see within 5145 event IDs the various suspicious tmp values written to administrative file shares on the host that was the target for the credential dumping.
We can also see relative target names like winreg, samr, svcctl. If we combine the suspicious elements observed in these events alongside the initial suspicious login, we now have a good idea of what technique was performed, where it was performed from, and what host was targeted for registry credential dumping.
Once again, we take various pieces of information, like 4624 and 5145 events, and analyze them to turn this information into actionable insights. This is a prime example of how important methodology is to intrusion investigations.
Fancy tooling is definitely fun to use, but if you don’t have a solid process and methodology behind your analysis, tooling will only serve as a distraction. Often, tooling will also abstract analysis from you. For example, you may only work with tooling that labels activity as “Registry Credential Dumping” and presents the information it has to you, but does not expose the raw telemetry it used to make this determination. The closer you position your analysis techniques to the raw telemetry, the more refined your methodology becomes.
Lateral movement
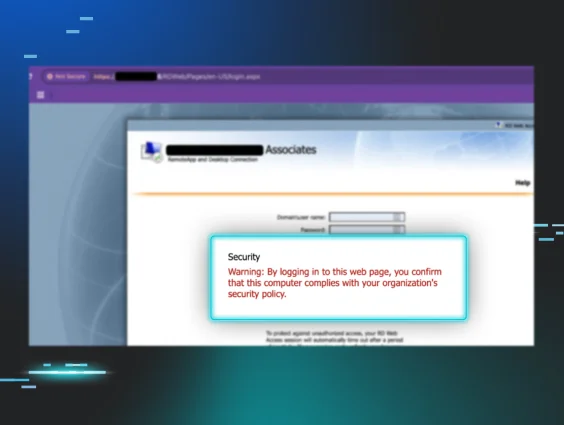
One of the more popular methods for lateral movement that we come across is the Remote Desktop Protocol (RDP). Threat actors like targeting RDP because it provides a graphical interface and is usually enabled in networks.
As you begin searching Google for information related to RDP authentication events, you’ll likely find guidance telling you to look at security event ID 4624 with a logon type of 10. An example of this event can be found below.

Figure 11: Windows event ID 4624 showing a successful RDP login
This is indeed a fantastic indicator of RDP activity. This event clearly shows where the login came from, as well as the username used for the RDP connection.
During an intrusion, if you suspect RDP lateral movement activity is going on, you usually rush to open up Event Viewer, browse to the security log, and get greeted with the following:

Figure 12: Image showing event ID 1102 - Security log cleared
Indicator removal, particularly the cleaning of the Windows event log—specifically the security log channel—is a technique that we unfortunately encounter a lot.
If you’re fortunate enough to have a SIEM in place, this technique is likely less worrisome, as the telemetry has already been shipped off the system on which the logs were cleared.
But, what happens if you don’t have a SIEM in place and want to investigate this RDP lateral movement? The following log channels can swoop in and save the day:
Microsoft-Windows-TerminalServices-LocalSessionManager/Operational
and
Microsoft-Windows-TerminalServices-RemoteConnectionManager/Operational
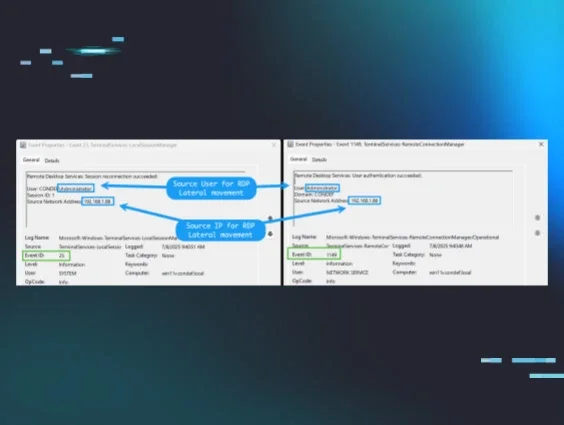
Specifically, we can use event ID 25 and event ID 1149 to find the source of RDP lateral movement, should the security log be cleared.

Figure 13: Image showing two Windows events triggered by successful RDP authentication
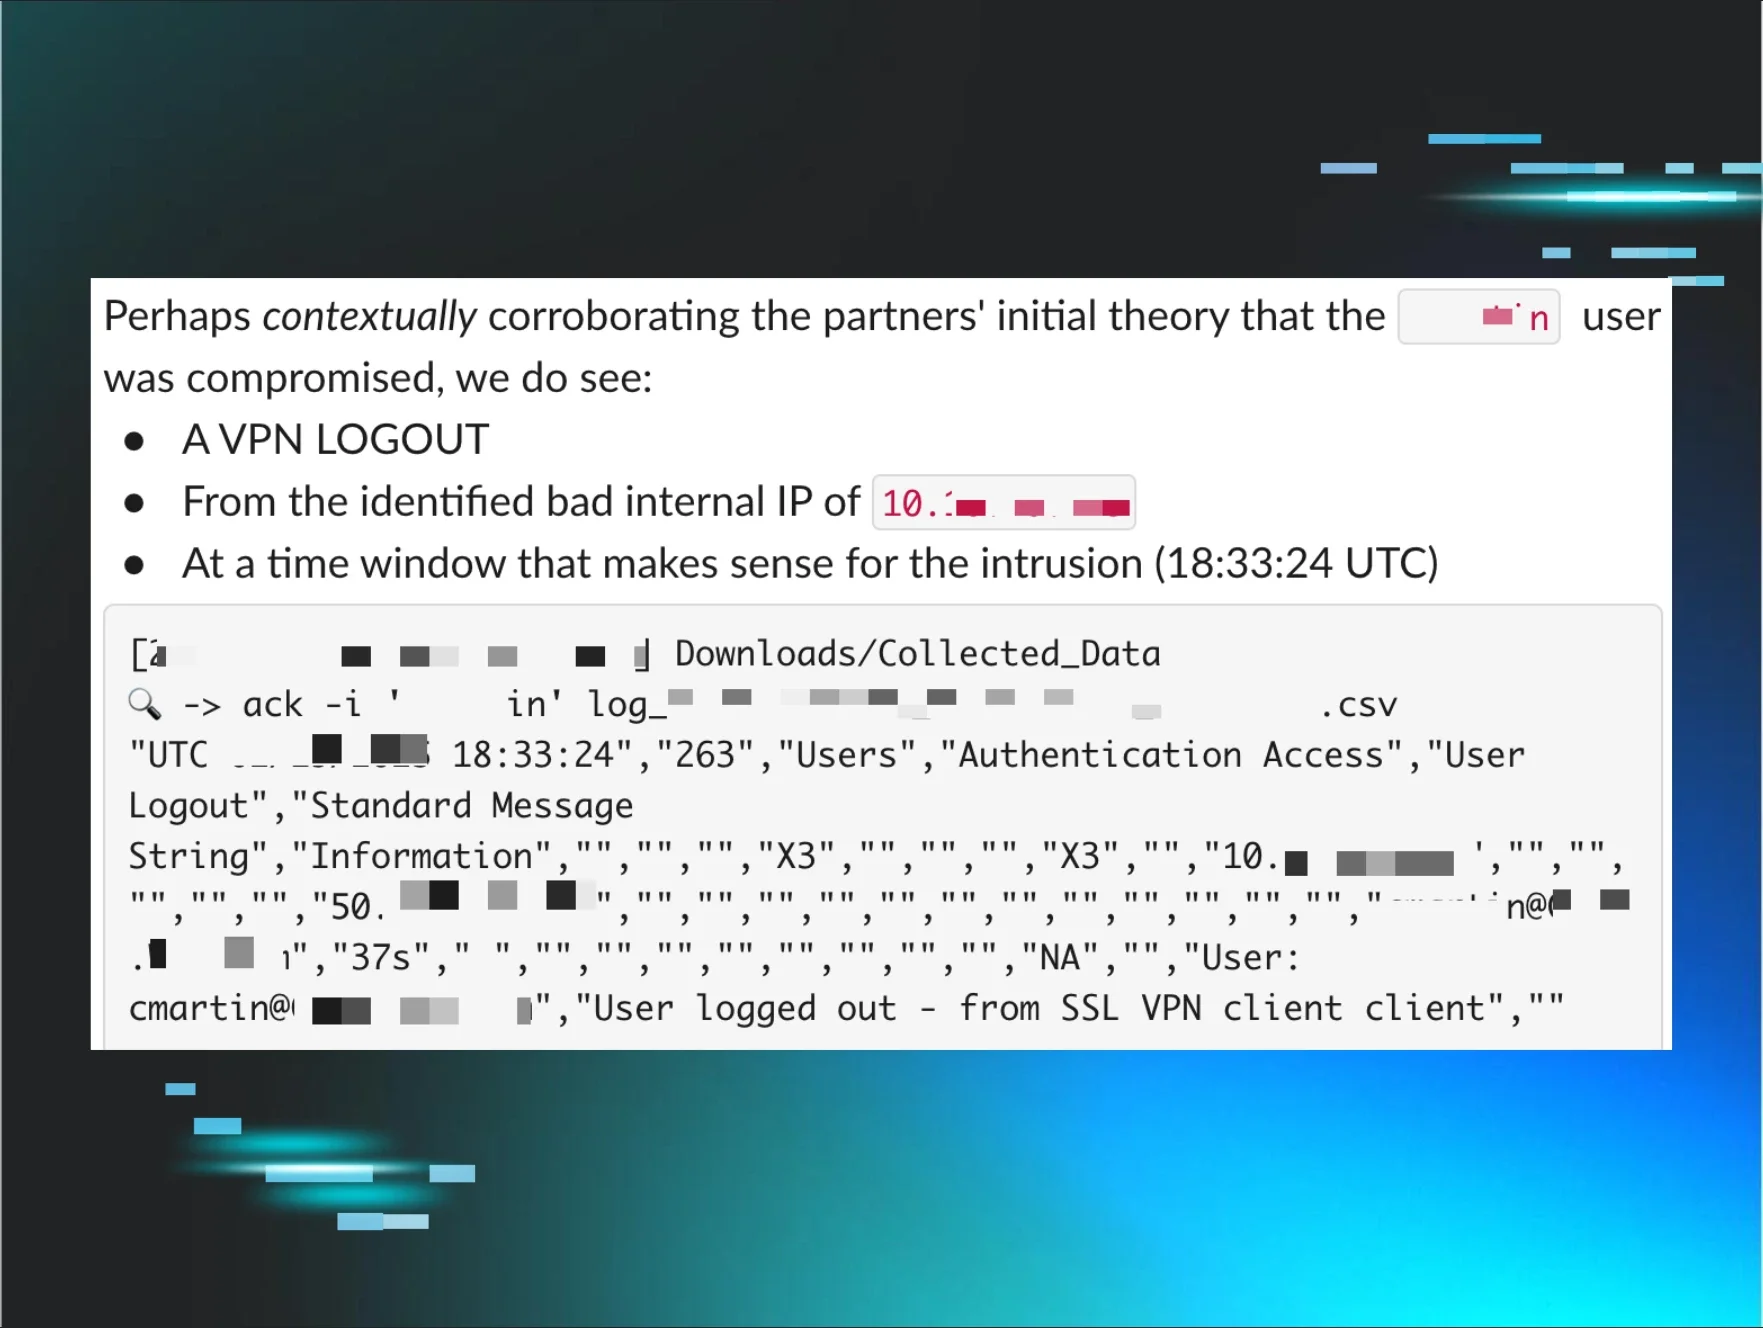
These events are extremely valuable and important, even if the security event log has not been cleared, since a type-10 4624 event isn’t always generated on every RDP-related login. In this case, the IP addresses are internal. However, if your RDP server is internet-exposed, you may find external IP addresses in this telemetry. From here, you can use IP enrichment, particularly ASN information, to determine whether the event is malicious or benign.
Check out our blog on how to use this ASN information for hunting and response!
This dynamic again illustrates the difference between looking for information in standalone events and applying a sound methodology to extract insight from this information. It’s very easy to overlook certain nooks and crannies within event logs. If you don’t see 4624 type-10 events, it doesn’t necessarily mean no RDP lateral movement took place.
Conclusion
Today, information is plentiful. There are thousands of write-ups, videos, blogs, tutorials, courses, et cetera, on virtually any offensive security or DFIR-related topic. This is not to mention the capabilities that LLMs provide. However, insights are missing from this abundance of information.
We often get so wrapped up in presenting as much information as possible to various stakeholders that we forget that information needs to be processed and analyzed through a repeatable process, underpinned by solid and proven methodology.
This blog has presented various scenarios in which information is turned into insights through the methodology used by the Tactical Response team here at Huntress.